EUR/USD jumps back above 1.1700 amid rumors of a peace deal in Ukraine
- EUR/USD retraces previous losses and returns above the 1.1700 level.
- News about progress toward a potential Russia-Ukraine peace deal has boosted support for the Euro.
- Market concerns about the fragility of Iran's ceasefire are dampening risk appetite.
The (EUR) has rallied about 30 pips against the US Dollar (USD) on Friday's European trading session, returning above 1.1700 and turning positive on daily charts. News reporting that Russia and Ukraine are drawing closer to a truce has offset the dismal market sentiment about the fragile ceasefire in Iran.
Investors have welcomed a report from Bloomberg citing comments by a top aide of Ukrainian President Volodymyr Zelenskyy affirming that Kyiv is close to reaching a peace agreement with Russia.
Apart from that, Russia has announced a 32-hour Easter ceasefire, and a top Kremlin official affirmed that there can be peace today if Zelenskyy makes the decision, but he also added that Russia wants a steady peace rather than a ceasefire.
The Euro was on the defensive before that, with market sentiment weighed with Iran's ceasefire on thin ice. Tehran cast doubts about its participation in the peace talks scheduled for this weekend in Pakistan's capital amid alleged violations of the 10-point ceasefire deal by the US and Israel. US President Trump, on the other hand, complained about Iran’s poor management of the sea traffic in the Strait of Hormuz, as less than 10% of the average traffic has crossed the waterway in the last 24 hours, with mines and bureaucracy keeping a de facto blockade.
In Europe, German consumer prices data for March, released earlier on Friday, confirmed higher inflationary pressures stemming from Iran´s war and added pressure on the European Central Bank (ECB) to hike interest rates soon.
Later in the day, the focus will be on the US Consumer Price Index (CPI) data from March, which is also expected to have shown a significant acceleration, and might tip the scales on the Federal Reserve’s balanced monetary policy stance.
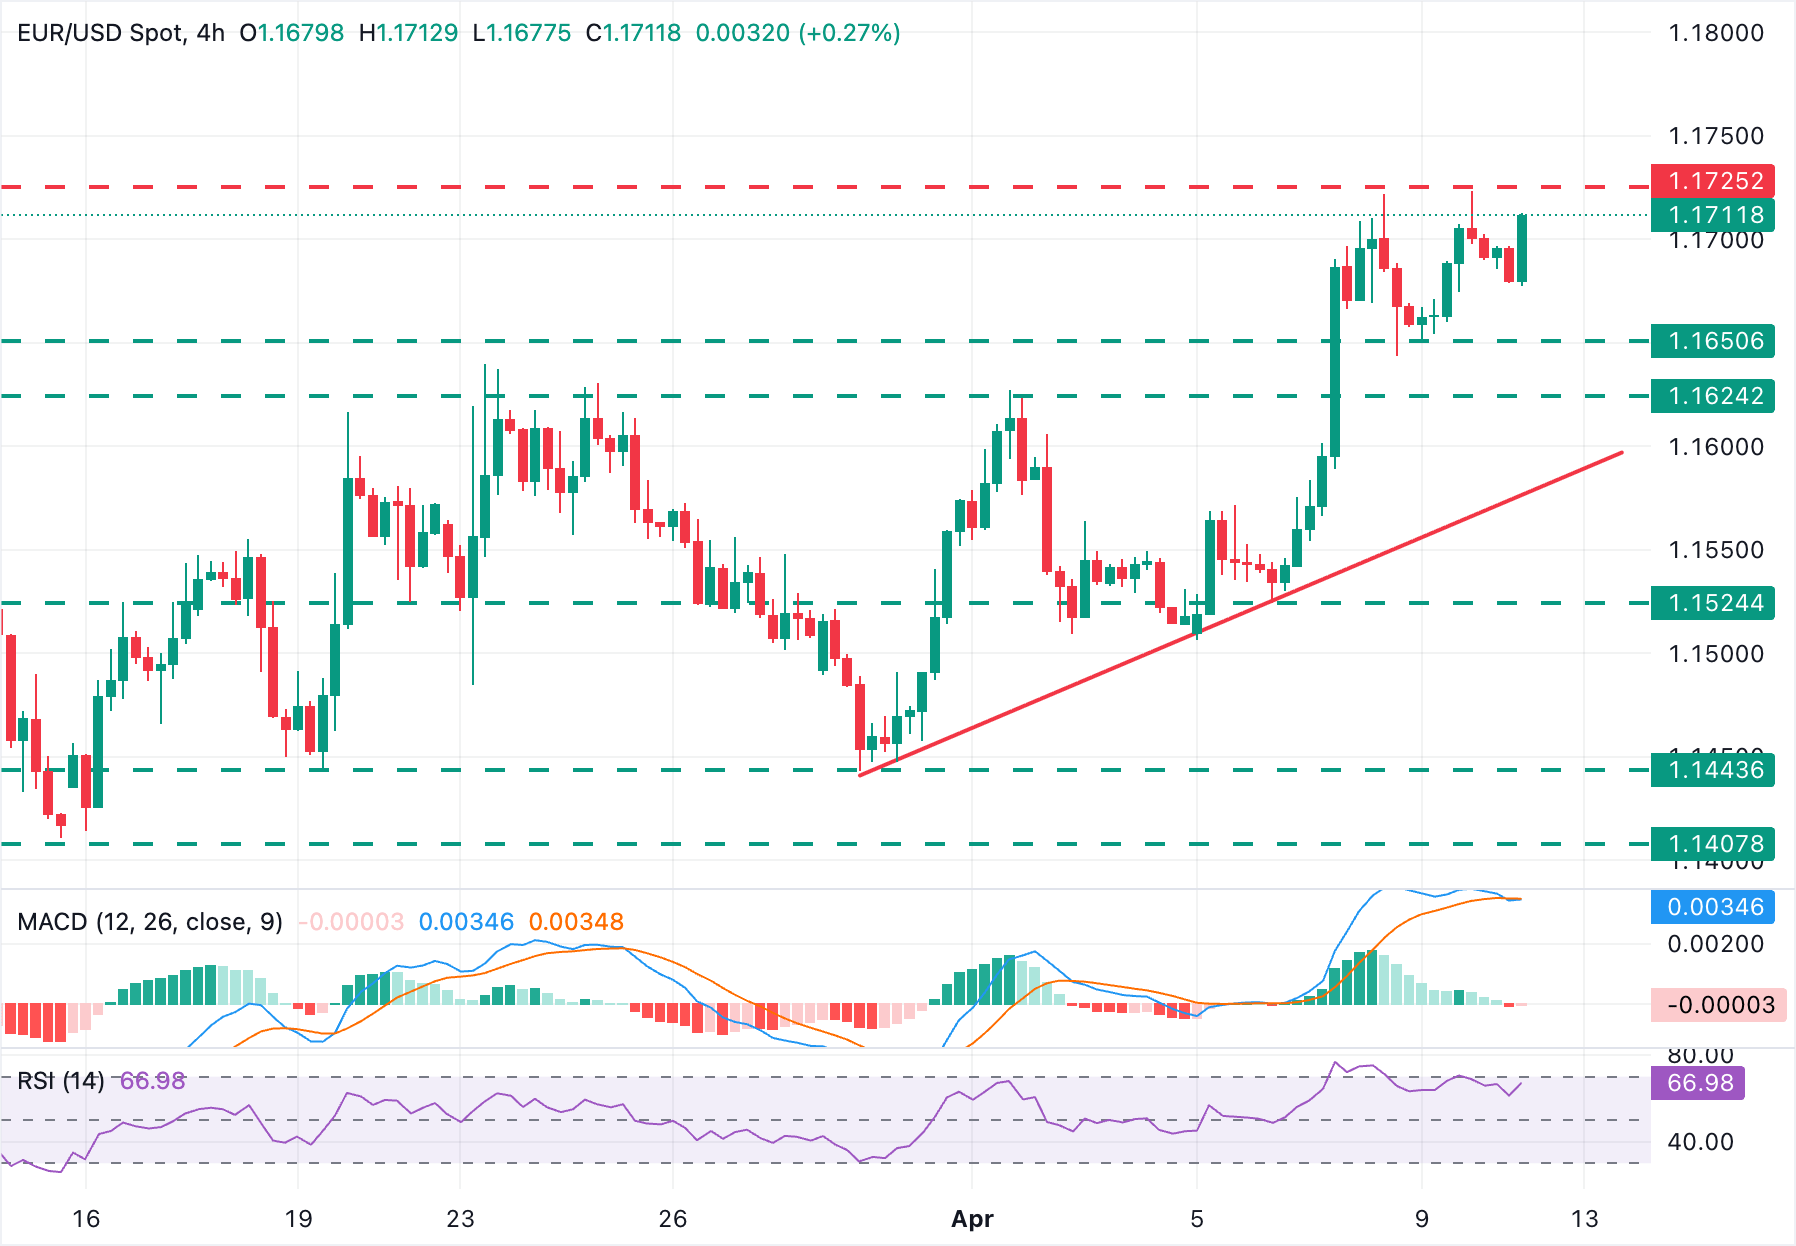
Technical Analysis: Bulls and bears struggle around 1.1700
EUR/USD is showing an impulsive rebound from session lows in the 1.1680 area, but the pair remains below the 1.1725 resistance area, and technical indicators are showing hints often seen ahead of a trend shift.
The pair shows a potential Double Top in the 1.1720 area, the 4-hour Relative Strength Index (RSI) reveals a bearish divergence, and the Moving Average Convergence Divergence (MACD) in the same timeframe is about to cross below the signal line.
Immediate support remains at Thursday's lows in the 1.1650 area, which is the neckline of the mentioned Double Top pattern and the previous highs between 1.1630 and 1.1640. Further down, the trendline support from late-March lows is now at 1.1575.
To the upside, a confirmation above Thursday's high at 1.1723 would negate the bearish view and expose the February 26 and 27 highs near 1.1820.
(The technical analysis of this story was written with the help of an AI tool.)
Economic Indicator
Consumer Price Index (YoY)
Inflationary or deflationary tendencies are measured by periodically summing the prices of a basket of representative goods and services and presenting the data as The Consumer Price Index (CPI). CPI data is compiled on a monthly basis and released by the US Department of Labor Statistics. The YoY reading compares the prices of goods in the reference month to the same month a year earlier.The CPI is a key indicator to measure inflation and changes in purchasing trends. Generally speaking, a high reading is seen as bullish for the US Dollar (USD), while a low reading is seen as bearish.
Read more.Next release: Fri Apr 10, 2026 12:30
Frequency: Monthly
Consensus: 3.3%
Previous: 2.4%
Source: US Bureau of Labor Statistics
The US Federal Reserve (Fed) has a dual mandate of maintaining price stability and maximum employment. According to such mandate, inflation should be at around 2% YoY and has become the weakest pillar of the central bank’s directive ever since the world suffered a pandemic, which extends to these days. Price pressures keep rising amid supply-chain issues and bottlenecks, with the Consumer Price Index (CPI) hanging at multi-decade highs. The Fed has already taken measures to tame inflation and is expected to maintain an aggressive stance in the foreseeable future.
Economic Indicator
Consumer Price Index ex Food & Energy (YoY)
Inflationary or deflationary tendencies are measured by periodically summing the prices of a basket of representative goods and services and presenting the data as the Consumer Price Index (CPI). CPI data is compiled on a monthly basis and released by the US Department of Labor Statistics. The YoY reading compares the prices of goods in the reference month to the same month a year earlier. The CPI Ex Food & Energy excludes the so-called more volatile food and energy components to give a more accurate measurement of price pressures. Generally speaking, a high reading is bullish for the US Dollar (USD), while a low reading is seen as bearish.
Read more.Next release: Fri Apr 10, 2026 12:30
Frequency: Monthly
Consensus: 2.7%
Previous: 2.5%
Source: US Bureau of Labor Statistics
The US Federal Reserve has a dual mandate of maintaining price stability and maximum employment. According to such mandate, inflation should be at around 2% YoY and has become the weakest pillar of the central bank’s directive ever since the world suffered a pandemic, which extends to these days. Price pressures keep rising amid supply-chain issues and bottlenecks, with the Consumer Price Index (CPI) hanging at multi-decade highs. The Fed has already taken measures to tame inflation and is expected to maintain an aggressive stance in the foreseeable future.